
Deliverables
Reports & workbooks: what RankGear hands you
Every run leaves artifacts you keep — a timestamped, color-coded XLSX workbook plus the HTML reports you choose, readable in-app, white-labeled for clients, and publishable as a branded report hub.
Readable without leaving the app
The in-app Reports library shows factor-family coverage, opens any generated HTML inside RankGear, and reveals the workbooks in your file system. A genuine measured zero for your tracked page is shown in red, so it never disappears into a wide comparison. “What RankGear measures” writes the full factor reference as its own report.
See the factor reference →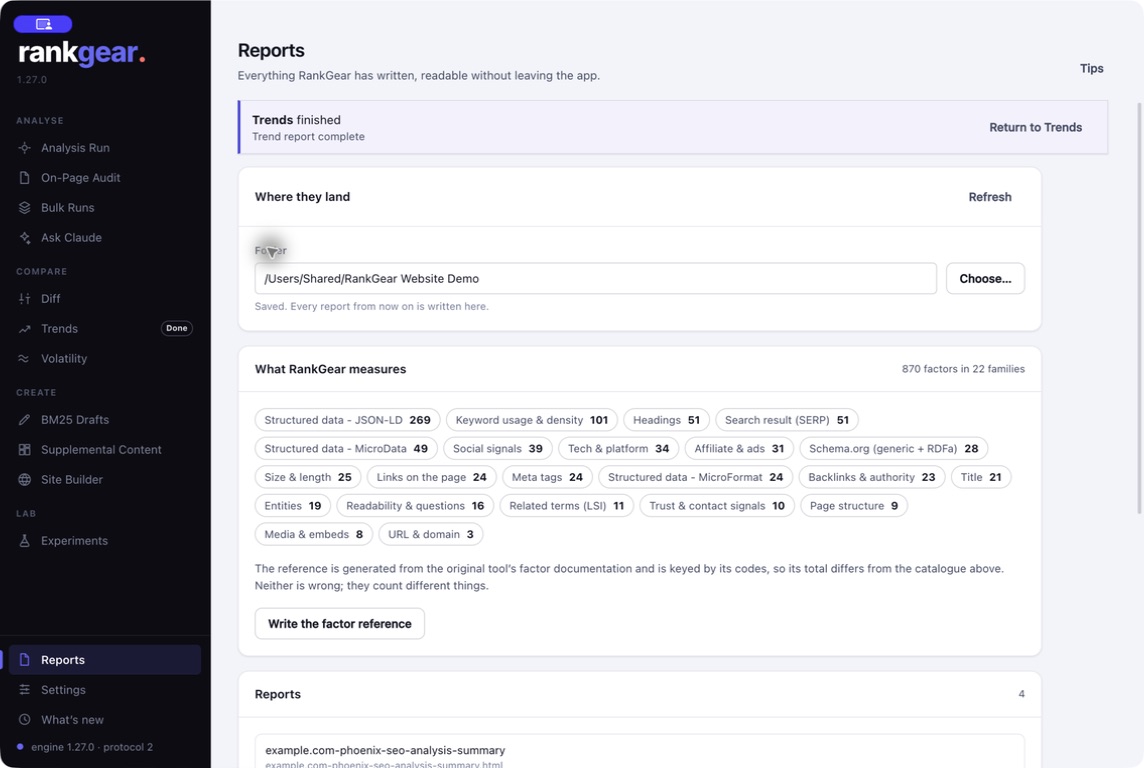
Inside the workbook
Tabs grouped by the question they answer
Start Here links to the first available sheet in each group; the colors tell you what you’re looking at:
- Orientation
- Start Here, Overview, Strategy Summary — what this workbook is, what matters, and where to begin.
- Recommended work
- Action Plan, Quick Wins, Roadmap, Work Order, Tunings — what to change, in what order, and by how much.
- Competitive analysis
- Structure, Top Factors, Usage, Charts, Page Analysis, Details, BM25F, Zone Architecture — how your page compares with the ranked field.
- Content & entity research
- Topical Heatmap, Variations, Density, LSI, YAKE, Questions, Sentences, Schema, plus Entities, Entity Gaps, and Entity Density.
- Links & authority
- Basic Off Page, Outbound Links, and Raw Links Data — how authority and link patterns differ.
- Source data & Maps
- Results (the exact ranked URLs that formed the field), plus Local, Maps, Attractions, Landmarks, and Service Areas when you run local.
The HTML companions
From a dashboard to a client-ready summary
Every full analysis writes the workbook automatically; the HTML companions are yours to enable or disable without changing a single measurement:
- Analysis Summary — the in-app dashboard reproduced as a self-contained, branded artifact.
- Strategic Summary — the decision layer for a client: intent, category progress, the top supported priorities, and up to ten statistically significant factor charts.
- Content comparison, JSON-LD examples, and factor documentation written alongside the workbook.
Charts match the evidence instead of defaulting to a line: adoption for binary signals, scatter for rank relationships, distribution for the field’s spread, bullet for target comparison, and ranked bars for individual competitors. Line charts are reserved for real time-series.
Branded, and publishable
White-label the HTML header and footer for client-facing reports. Then use Site Builder to turn a folder of reports into a browsable, branded intelligence hub — with an index and a sitemap — and publish or update it directly over FTPS, FTP, SFTP, or SCP, without leaving RankGear.
See it in Use Cases →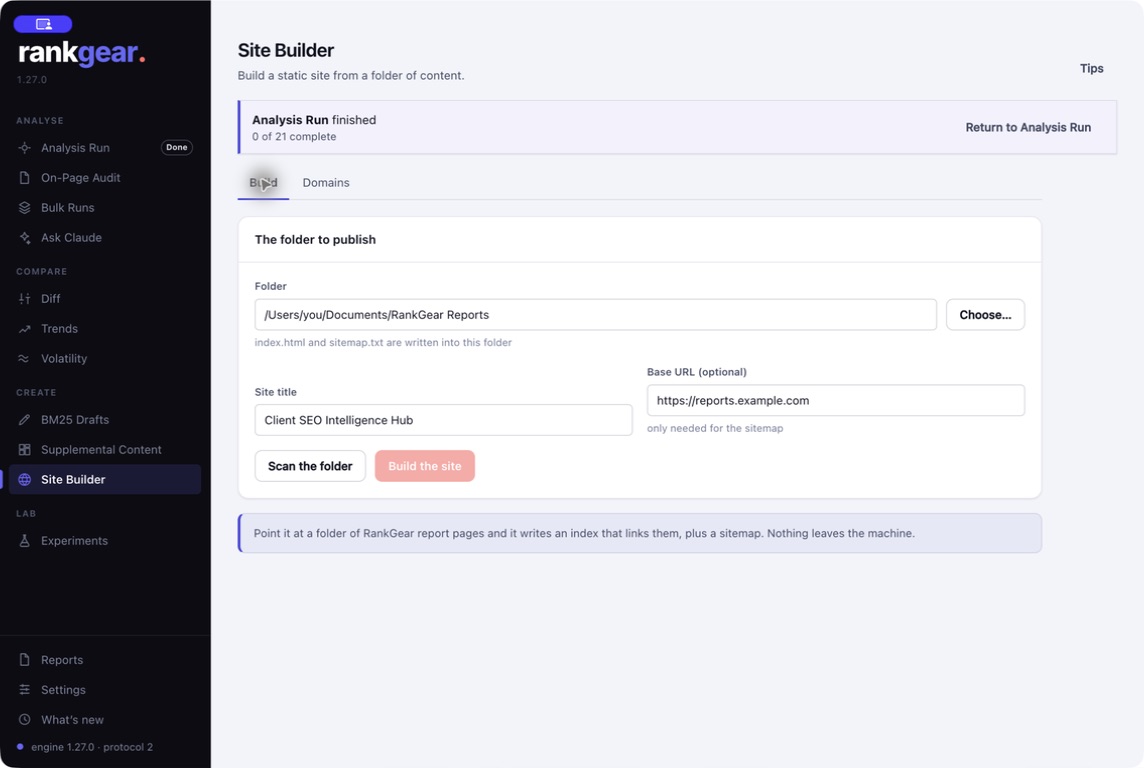
Questions, answered
Does RankGear overwrite old reports?
No. Filenames carry the target domain, keyword, date, and time to the millisecond, plus the report type — so multiple runs for the same query and day coexist.
Can I brand client reports?
Yes. Branding settings add a custom header and replace the default footer on the shared report design; the rest of the editorial shell stays consistent.
What formats can I export?
The XLSX workbook plus self-contained HTML companions; Supplemental Content also exports TXT, Markdown, and PDF.
Where are my reports stored?
In a local folder you choose — nothing is uploaded. Site Builder publishes to hosting you control, on your own credentials.
Deliver evidence, not screenshots.
Every run leaves a workbook and a report you can hand to a client.
macOS 14+ (Apple silicon) · Windows 11 (x64/ARM64) · bring your own provider accounts